Insights & export
Explore the insights dashboard
Updated May 20262 min read
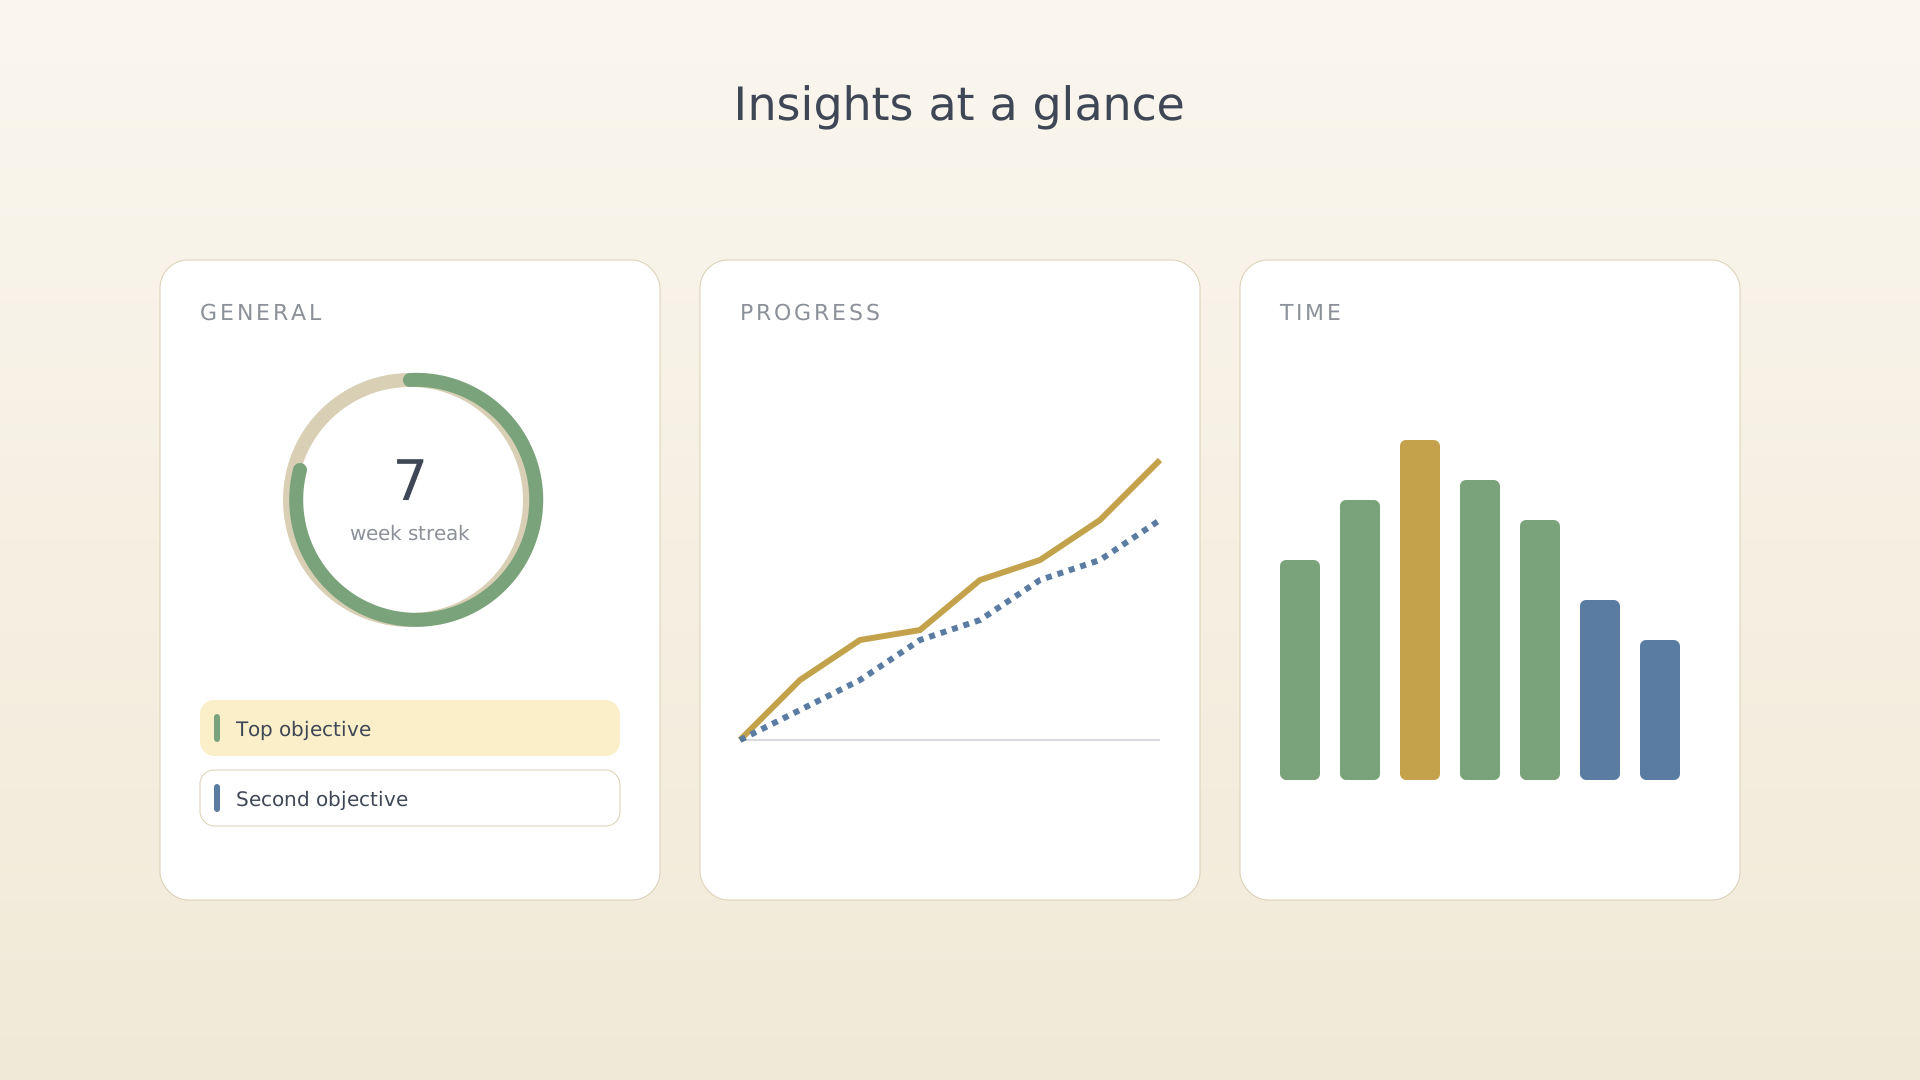
The insights dashboard answers the questions you don't ask out loud: am I making progress, am I steady, am I overspending on one part of my life? Three tabs split the answers across general, progress, and time views.
From the bottom navigation
- Tap the dashboard tab at the right of the bottom navigation.
Dashboard tab on the bottom nav - Switch tabs at the top of the screen — General, Progress, Time.
General
Milestones countdown, consistency streak, top objectives by progress, the
quote of the day.
Progress
Burndown by objective, key-result trend lines, and category mix. Compare a
quarter against the previous one.
Time
Weekly time per category, top activities by hours, sessions log. Tap a
session row to edit it.
Tips
- Most insights widgets are tappable — they open the underlying objective or session.
- Scrolling each tab reveals deeper widgets; the top ones show the fastest signals.
See also
Was this article helpful?
Related articles
Export an OKR mindmapGenerate a shareable mindmap of your IdealWeek OKR tree as a PNG. Open Settings → Export OKRs, pick a scope and line style, then save or share the rendered image.Export an ideas mindmapRender your IdealWeek ideas as a shareable mindmap PNG. Open Settings → Export Ideas to choose pinned-only or full scope, pick a line style, and save the result.